


“October: This is one of the peculiarly dangerous months to speculate in stocks. The others are July, January, September, April, November, May, March, June, December, August and February.”
― Mark Twain
As we reach the end of October and prepare for the final stretch of 2020, I wanted to share a little perspective on what has been a most interesting year.
At the start of 2020, the major challenge for investors was navigating the uncertainty revolving around the coming presidential election. Well, we got plenty of that PLUS a worldwide pandemic thrown in for good measure!
We could talk about the economic ups and downs of 2020 all day long, but looking at the economy through charts often tells a story in ways words cannot. So, please enjoy our “Fall Chart-a- Palooza.”
Asset Class Returns
2020 brought several firsts.
- US markets slipped from Bull to Bear in the shortest time frame in history.
- The Federal Reserve and Congress approved unprecedented fiscal and monetary stimulus quickly and forcefully in March.
- And the markets made the quickest roundtrip from peak (February 19th) to trough (March 23) back to peak (August 18) in just under 6 months.
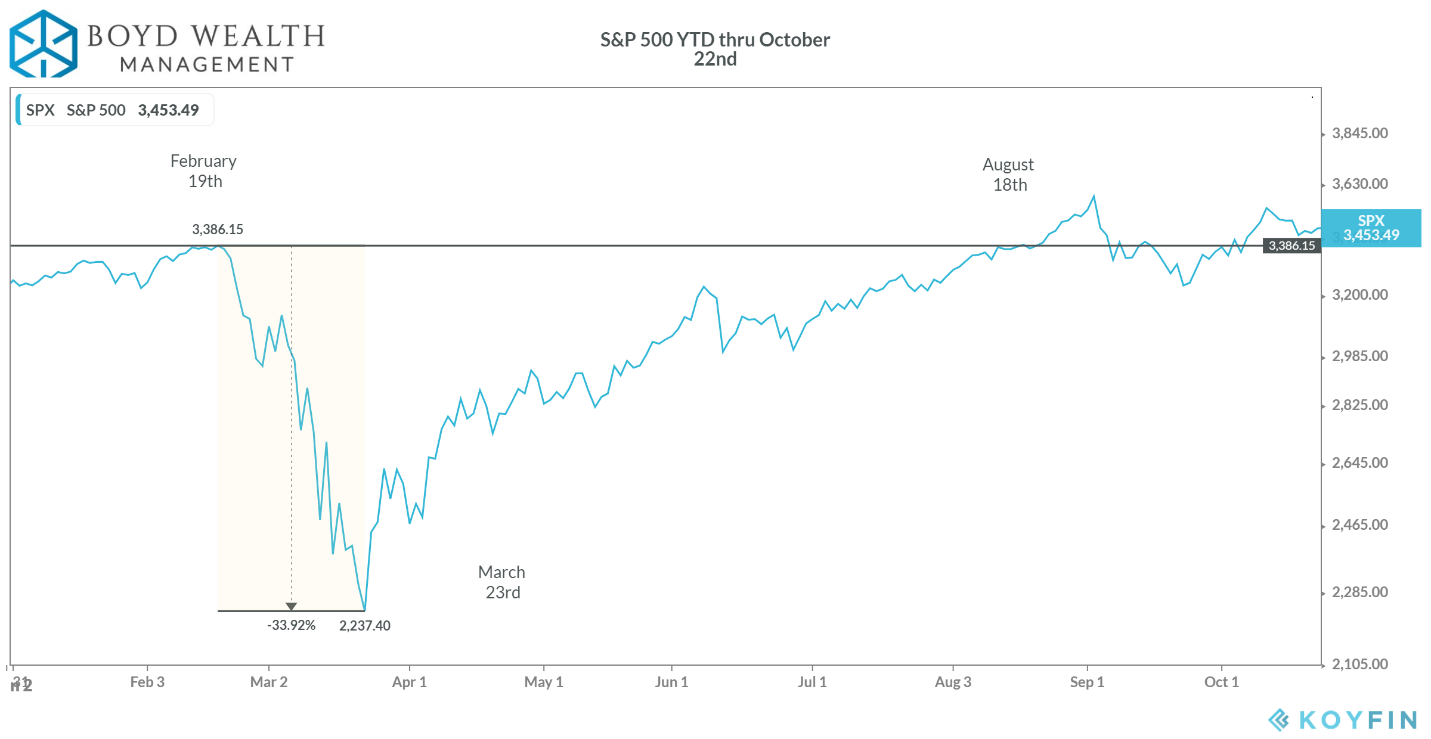 Source: Koyfin, roundtrip is from closing high to closing high, price only. *****Click to enlarge all charts****
Below is our Asset Class Returns Quilt with year-to-date returns of various asset classes through 09/30/2020.
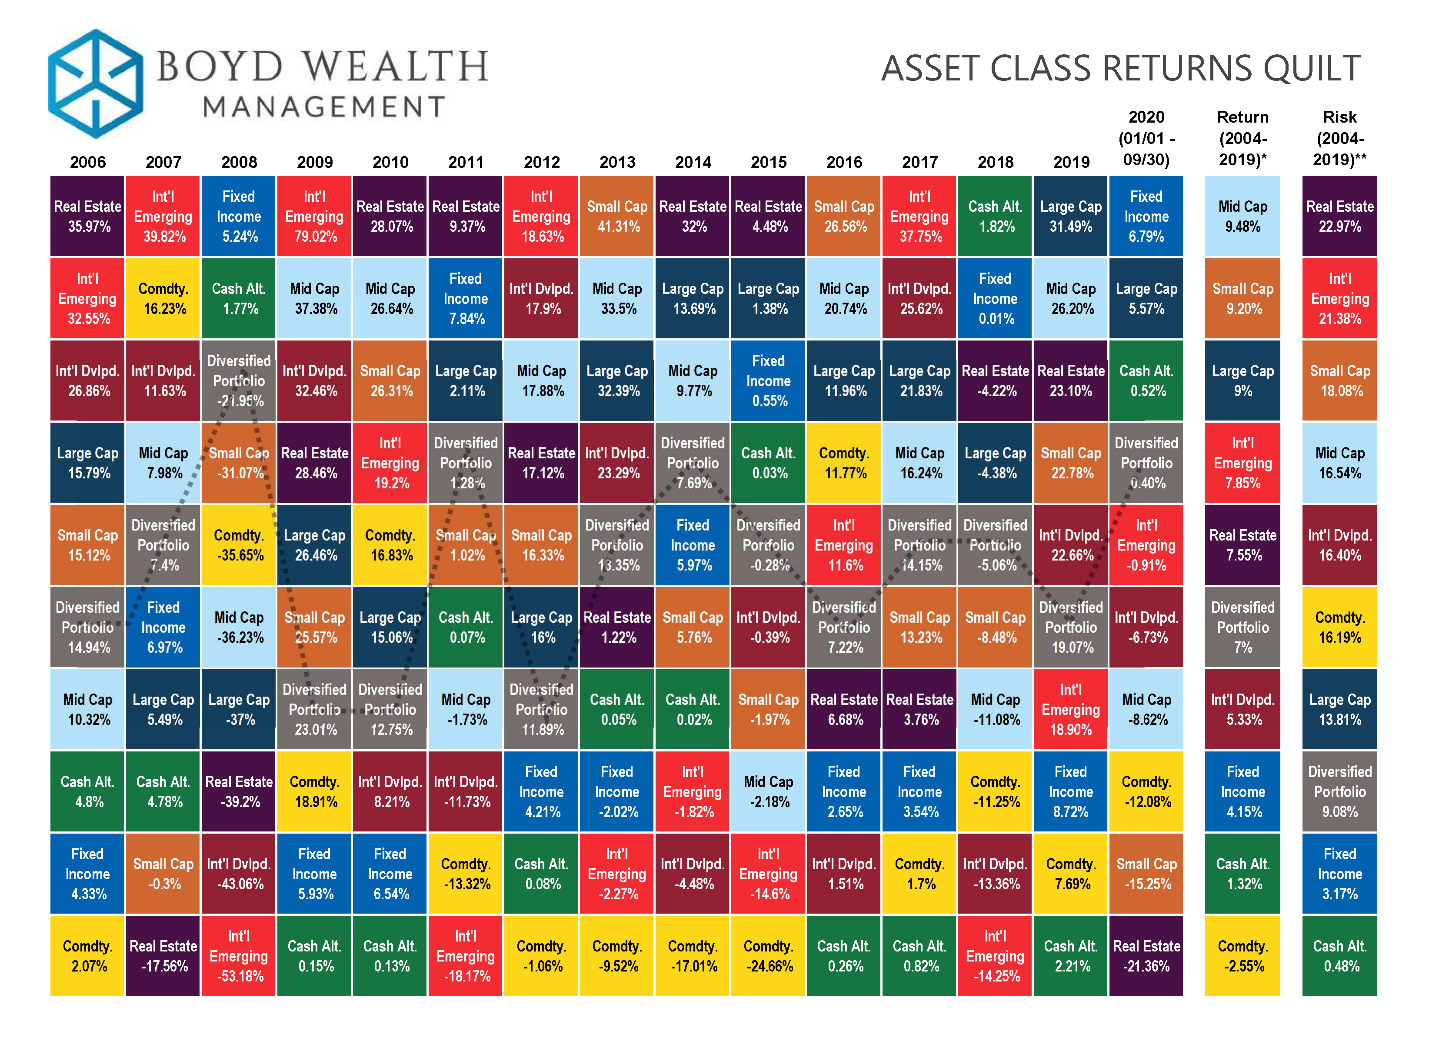
Source: Data from Morningstar Direct. Annual average returns and risk are thru 12/31/19.
Asset classes have performed largely as expected during a highly volatile year that’s included a deep recession.
Bonds have been the top performing asset class thus far, again proving their mettle during stock market declines. US Large Cap stocks has shown resilience, led by Big Tech and so called “work from home” stocks.
Riskier equity classes such as US Mid Caps, US Small caps, and Real Estate have suffered the most, given their capital structure and sensitivity to economic conditions.
Right smack in the middle of the quilt, with a slightly positive year-to-date return is the Diversified Portfolio. Reason again why we always preach diversification.
The Election
We are just days away from the Presidential election, so it’s fair to question the impact each candidate could have on the market. In February, we gave a primer on how markets typically perform during an election year.
It’s too simplistic just to say that America’s choice of President doesn’t impact the stock market. But we do see far too much weight credence to the influence one has. You will be comforted to know that markets have grown under Presidents from both parties.
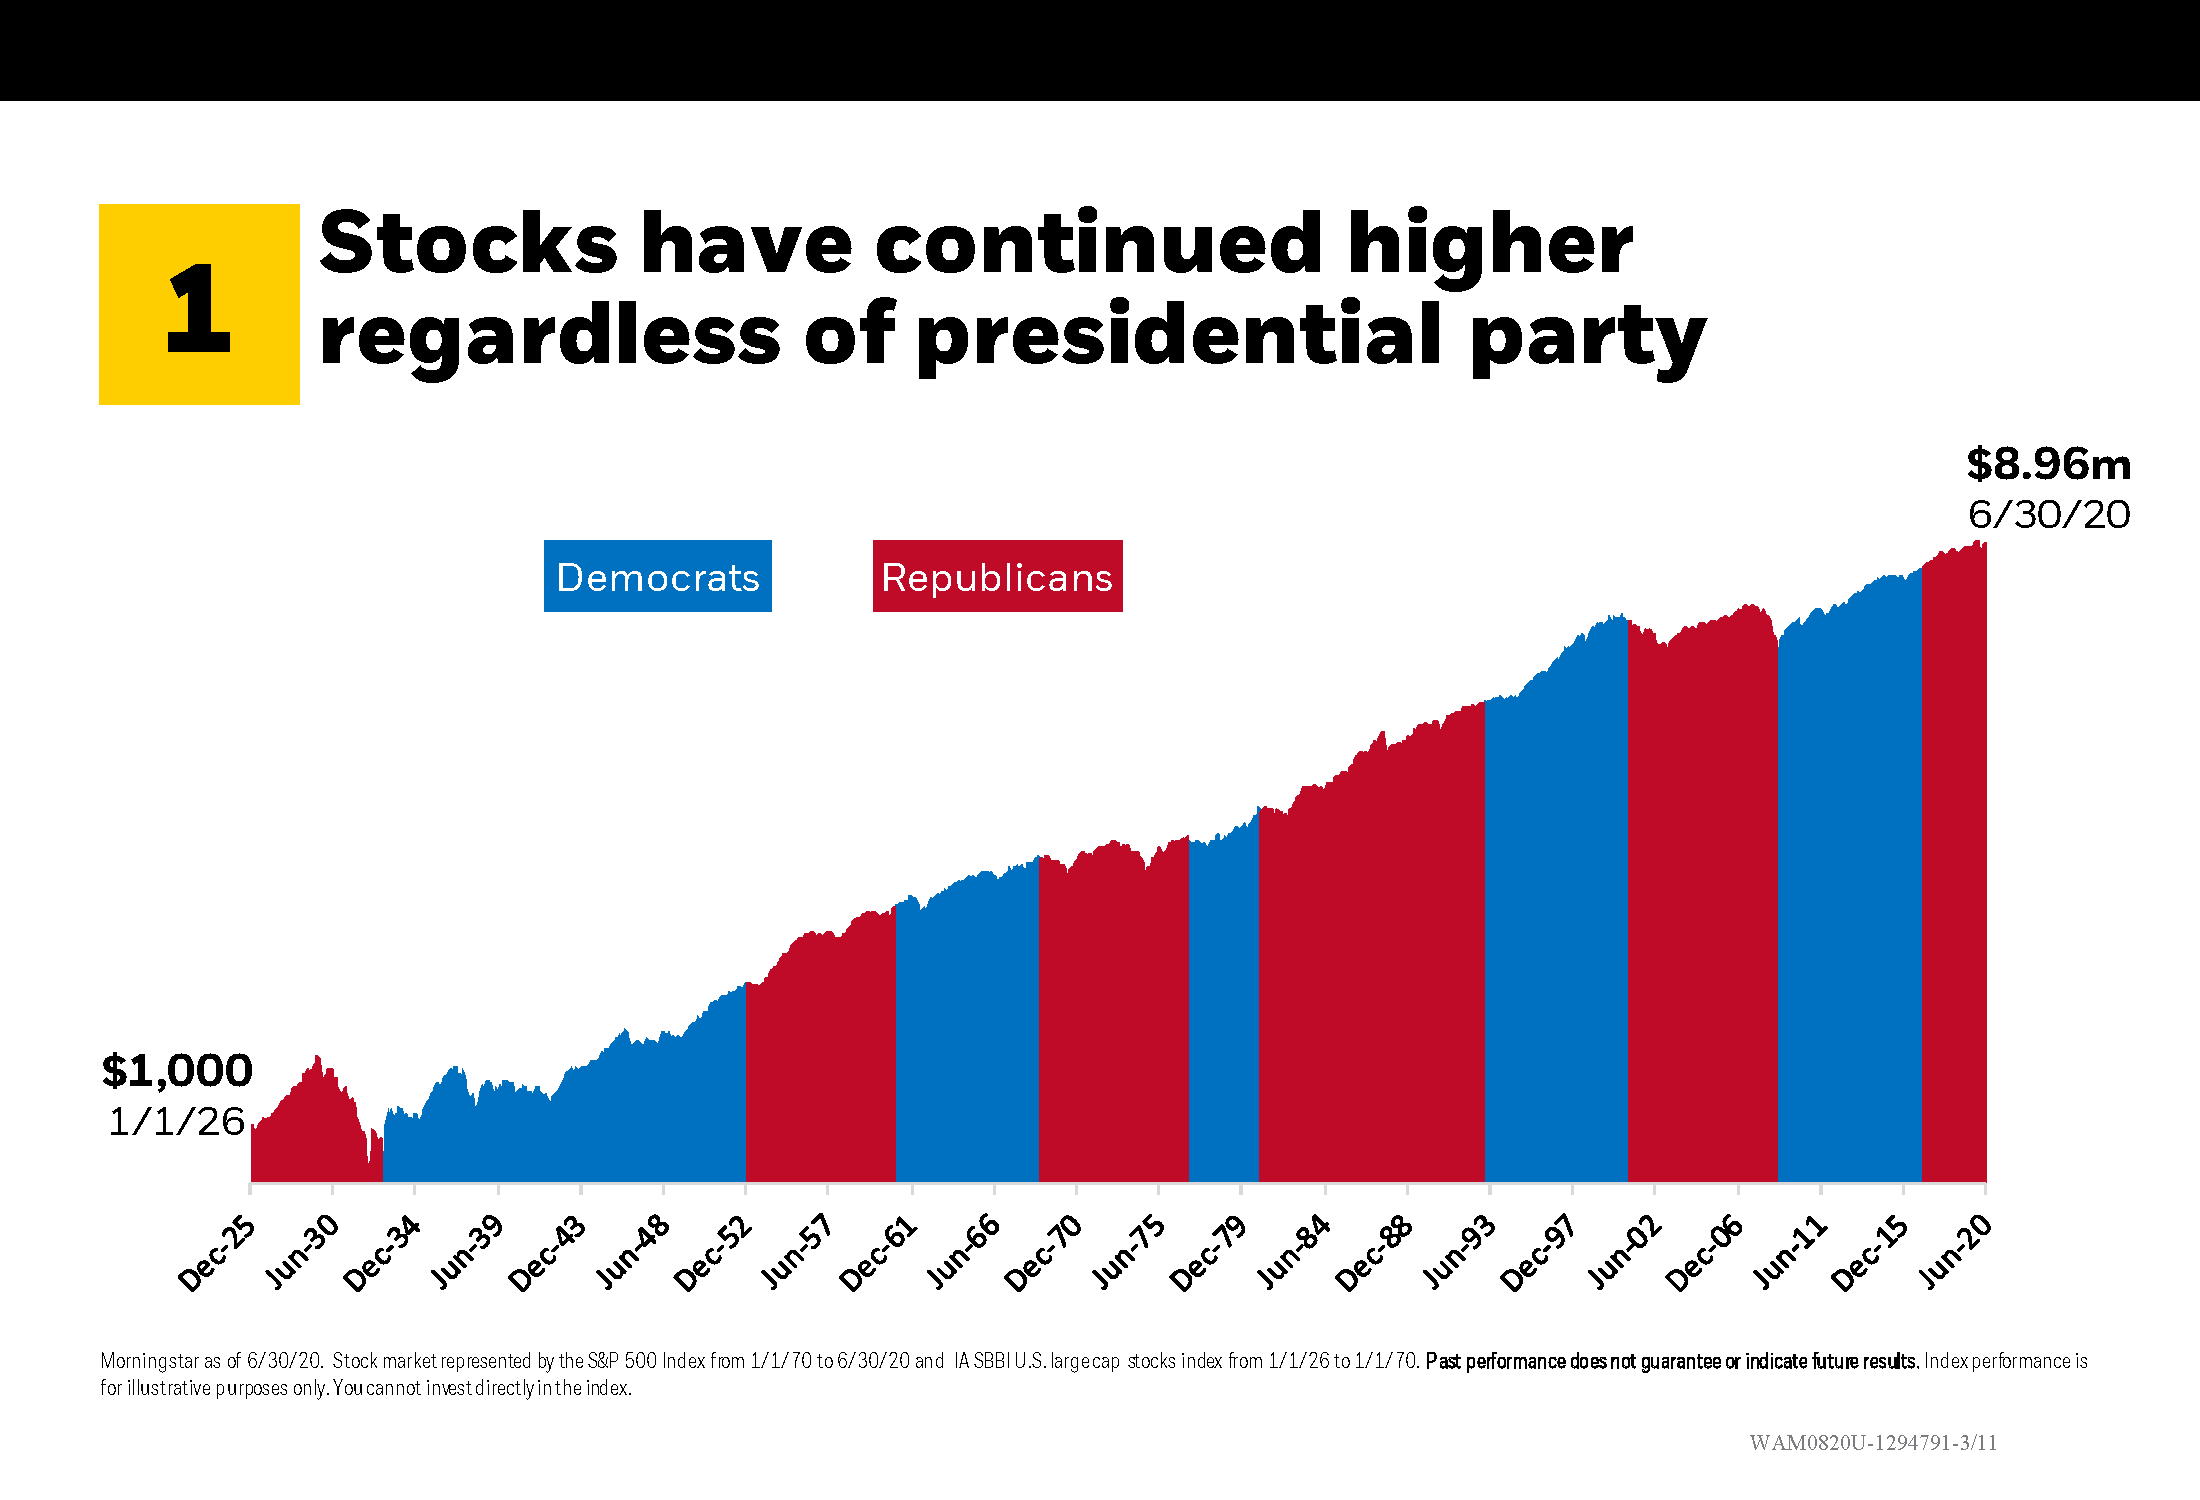
Source: BlackRock
Here’s a closer look at market performance under each President since Truman (1945):
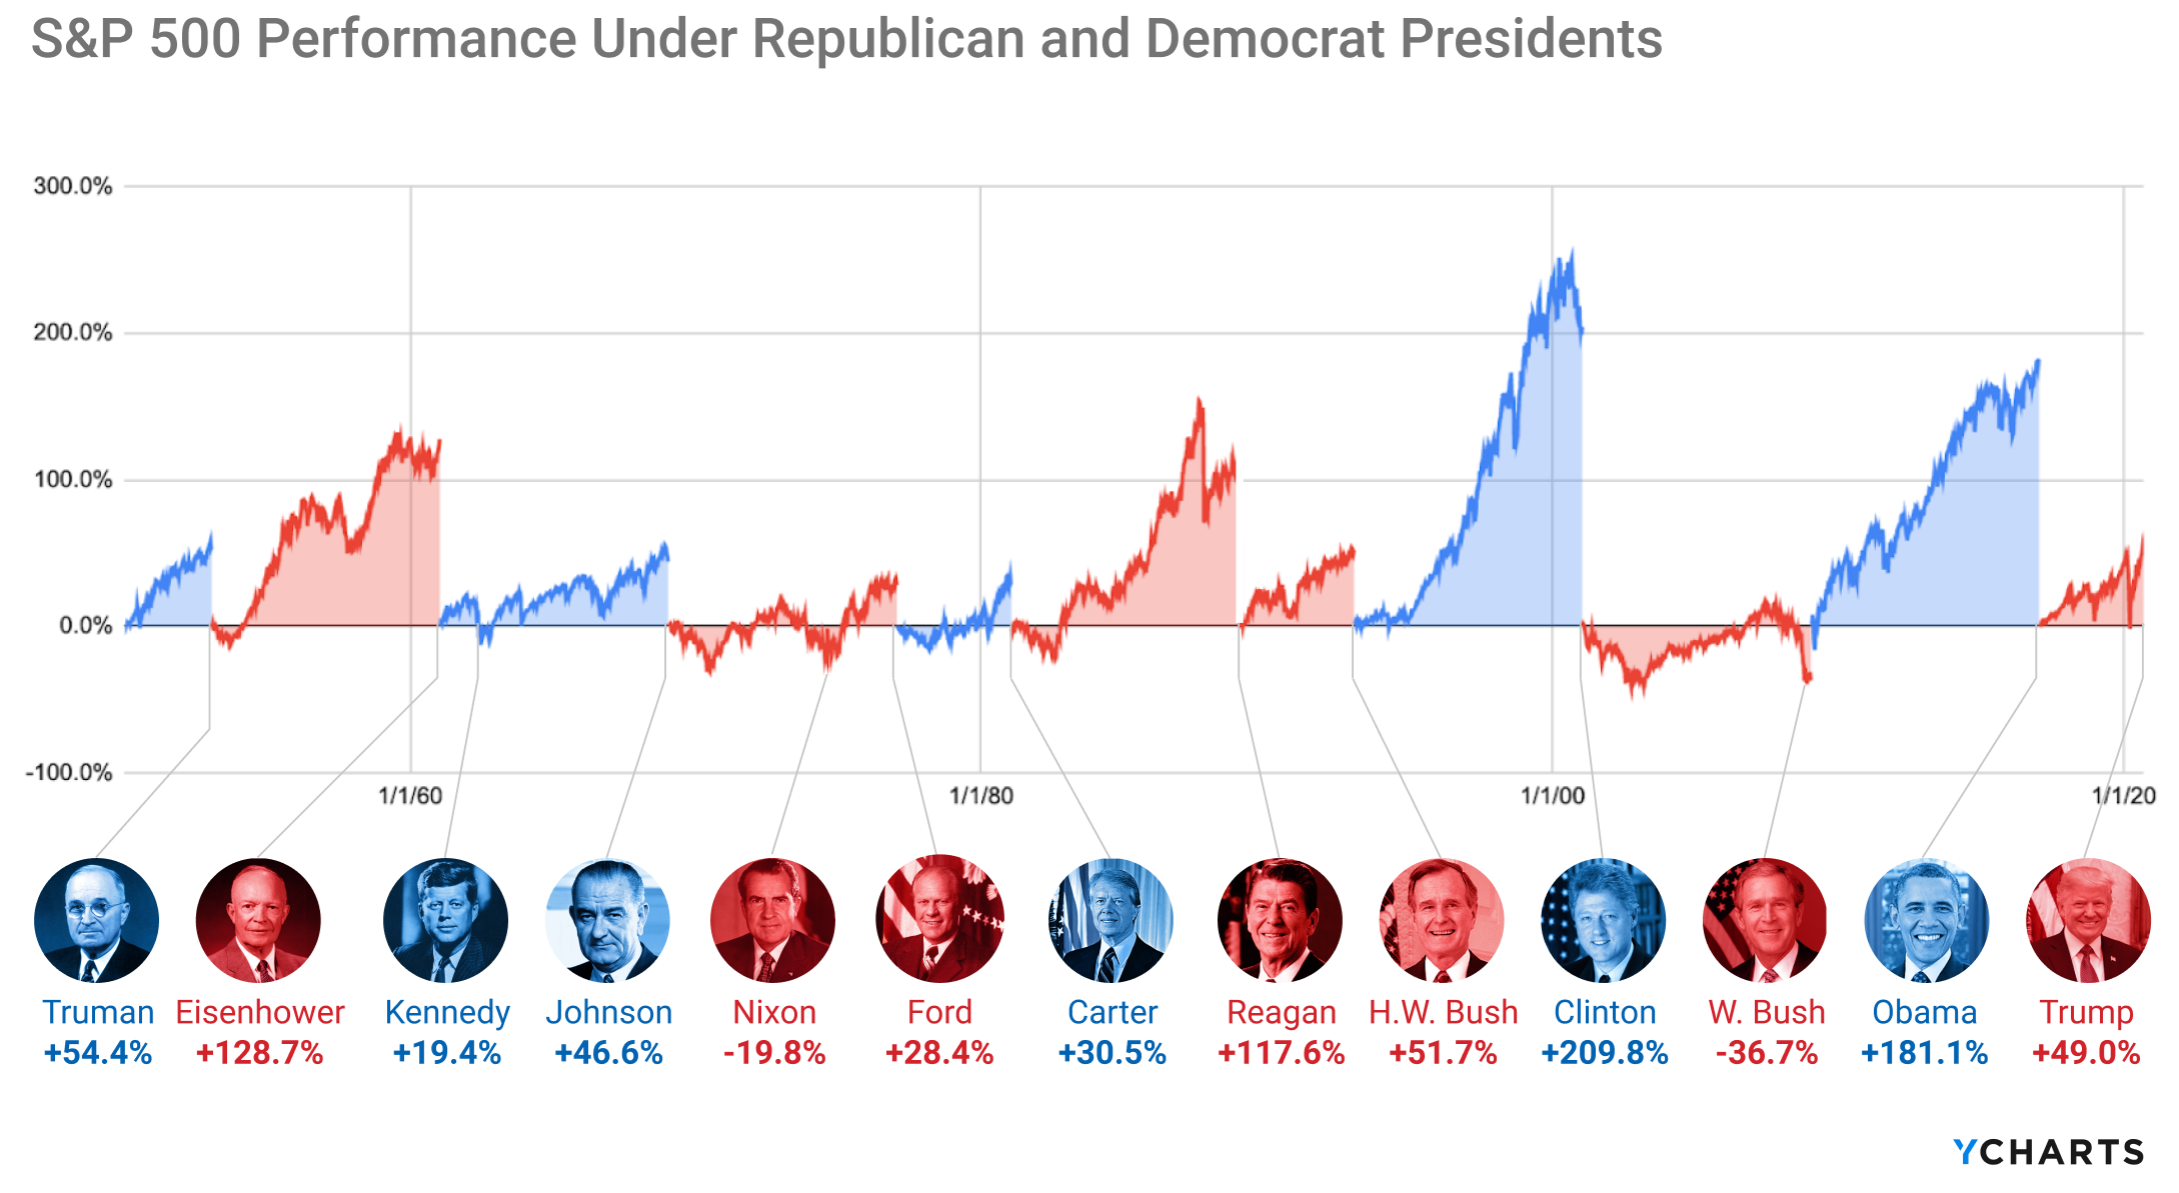 Source: YCharts
How have markets performed based on party control of the White House and Congress? Again, historically, markets have done fine regardless of party control.
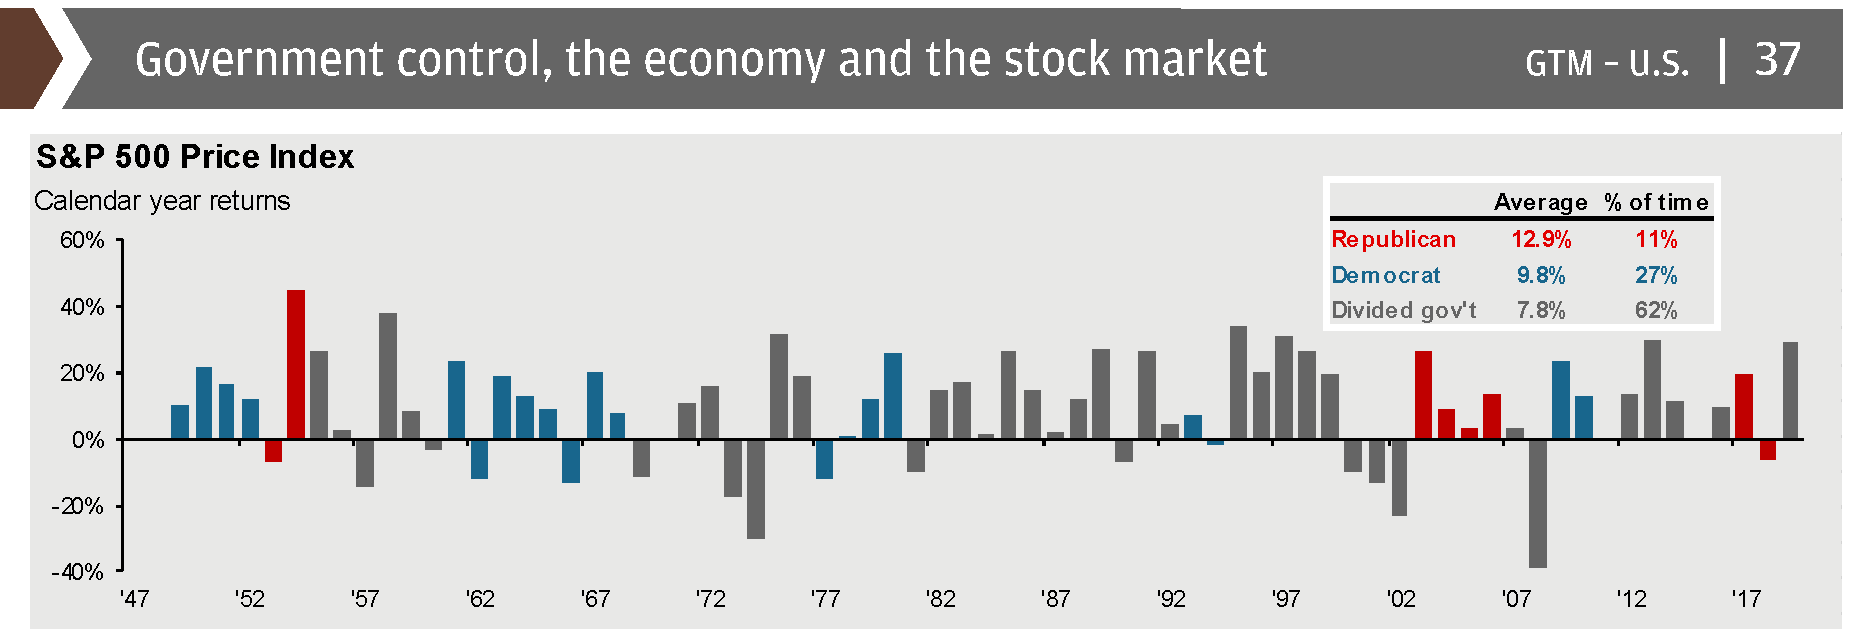
Source: JP Morgan Asset Management, Guide to the Markets, 9/30/2020
Coronavirus
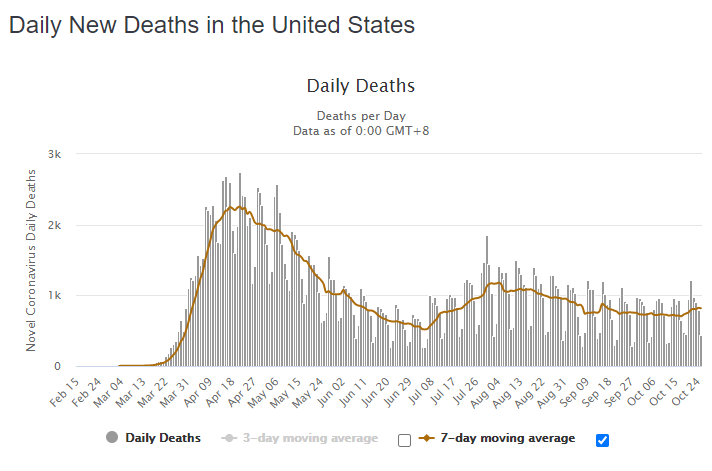
COVID-19 cases in the US have ebbed and flowed over the months, but new infections have now risen to their highest levels since the pandemic began.

Source: Worldometers
As cases rise and we fear a serious health crisis this winter, there are still persistent glimmers of hope.
According to NPR1, two peer reviewed studies point to a large drop in COVID-19 death rates. “The drop has been seen in all groups, including older patients and those with underlying conditions, suggesting that physicians are getting better at helping patients survive their illness.”
“Patients in the study had a 25.6% chance of dying at the start of the pandemic; they now have a 7.6% chance,” the article goes on to say.
Source: Worldometers
The vaccine news is also extremely encouraging, and the announcement of at least one safe and efficacious vaccine looks to be imminent. There are now 11 vaccines in late stage trials, with 6 approved for early or limited use.
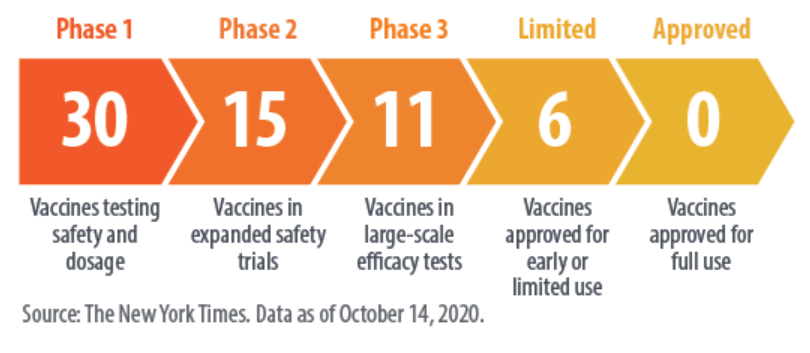
Source: FirstTrust COVID Tracker – October 15th, 2020
Even with such progress, the best projections for widespread distribution of a vaccine (other than to healthcare workers, the elderly and other at-risk populations) isn’t until mid to late 2021.
There is also fear that seasonal flu will combine with COVID-19 to overwhelm already stressed hospitals. But early indications show promise that this flu season won’t be a huge factor. According to the Centers for Disease Control2, flu season severity in the US typically correlates to influenza outbreaks in the Southern Hemisphere during the months of June-August. The countries of Australia, Chile, and South Africa demonstrated historically low influenza over this measurement period.
Australia is shown below with 2020 in dark blue. Dashed lines are comparison years. The results are similar in Chile and South Africa.

Lockdowns, mask wearing, hand washing, flu vaccinations, and a sharp decrease in global travel are all likely contributors to the positive trend.
The Economy
After posting an annualized drop of 3.1% in the first quarter and 31.4% in the second quarter, real GDP appears to be rebounding. The Atlanta Fed’s GDPNow calculations estimates third quarter GDP will rise 35.3%3. The advanced estimate from the government will be released October 29th.
 *Real GDP in Q1 was revised to -3.1%
Consumer spending continues an upward trajectory. The Chase consumer credit and debit card tracker is now showing that spending is off just 1.7% since the start of the pandemic.

The unemployment rate continues to improve gradually. The September reading showed an unemployment rate of 7.9%, down from a peak of 14.7% in April. In October, new claims for unemployment hovered near the lowest totals since the beginning of lockdowns.

Pockets of the economy such as travel and leisure still struggle. Air travel is down roughly 60%, but TSA traveler throughput hit one million passengers in October for the first time since March.

As we’ve noted before, the severe damage to the economy has been somewhat mitigated by the aggressive actions of the Federal Reserve and Congressional stimulus via the CARES ACT. Both parties appear to be committed to further stimulus, but as of this writing, have yet to agree on a deal.
It seems to be a given at this point that a package will come, with the only open question being size (~$1.8 billion - $2.3 billion) and timing.
This should offer further support to those businesses and individuals affected by continuing lockdowns and business closures, but at the expense of increasing national debt.
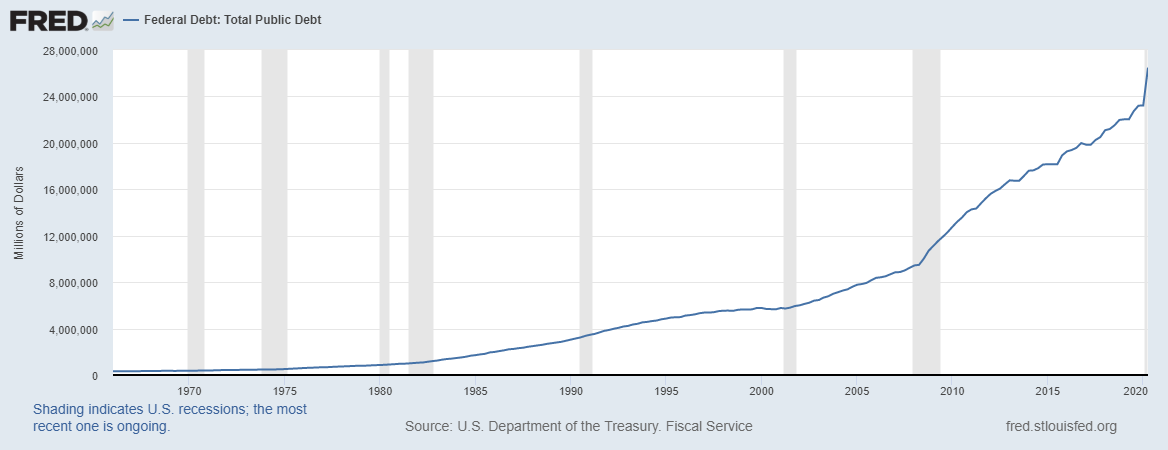
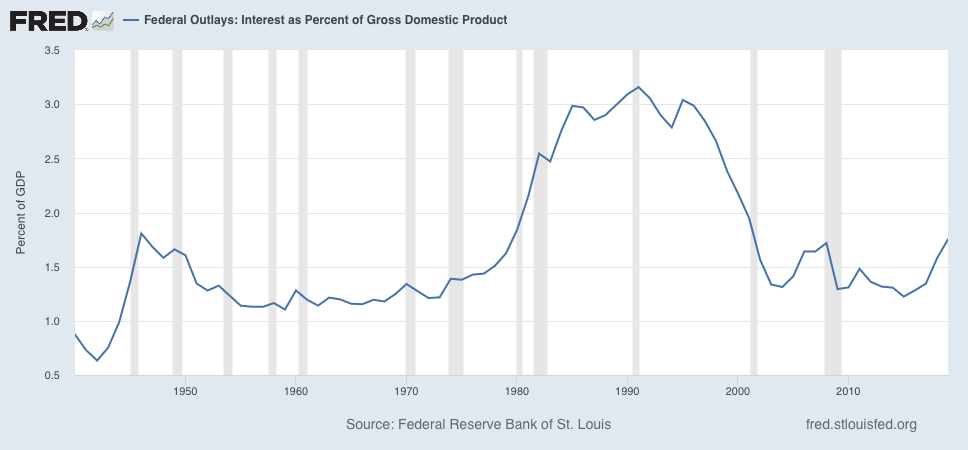
Source: Federal Reserve Bank of St. Louis
We’re often asked how we feel about the explosion in government debt, and it’s a fair question. As we noted before, during the mandatory lockdowns, lawmakers were presented with a “heads I win, tails you lose situation.” If the government offered no assistance, we very likely slip into a depression-like scenario. If assistance is provided via the Fed money machine, then we add significant debt. The latter was chosen without much dissent from either political party.
Ballooning government debt is less concerning in the short run than first appears. Low interest rates make the cost of servicing this debt manageable relative to history. Interest expense as a percent of GDP is shown below.
The longer-term risk is if there’s a sharp uptick in rates (perhaps to fight rapidly increased inflation as a result of all this stimulus) the cost to service our debt swells. Theoretically, this debt will need to be repaid, but there doesn’t seem to be an appetite for cost containment at present - from either party. The likely optimal tax plan of the future will be one that both sides hate – higher taxes and cuts to spending.
Ending on a High Note
It’s easy to focus attention on the serious social and economic issues faced both here and abroad. But I want to leave you with a bit of positive news. Ongoing improvement in civilization is like compounding interest – it happens subtly and is rarely noticed except when observed over time.
While the world population has exploded since the 1950’s, fewer and fewer people are living in extreme poverty. The world is getting better for more and more people, even if it feels at times like the opposite is true.

As we shift from the ghosts and goblins of Halloween to fallen leaves and the season of thanks, I hope you find plenty of blessings to count. I know we are thankful for each every one of you!
Happy Planning,
Brian
Sources/Further reading:
2. https://www.cdc.gov/mmwr/volumes/69/wr/mm6937a6.htm
3. https://www.frbatlanta.org/cqer/research/gdpnow
https://www.bls.gov/charts/employment-situation/civilian-unemployment-rate.htm
Asset Class Returns Quilt Data:
