


“I know I need to invest the money… I just don’t want to invest it at the worst possible time.”
I hear some version of this sentence frequently. I’m very sympathetic to the sentiment.
Usually it comes after someone has sold a business, inherited money, sold investment real estate, or accumulated a larger cash balance than they intended.
Lately, the concern often comes with a second thought:
“Stocks have already had three and a half strong years in a row. AI has driven markets to record highs. What if this is a bubble? What if I invest today and tomorrow is the beginning of the next bear market?”
Those are fair questions. In fact, I’d argue a healthy amount of skepticism is good for markets. If everyone believed stocks could only go up, I’d probably be more nervous than I am today.
The problem isn’t asking the question. The problem is believing you need the answer before you invest.
Meet Unlucky Larry
Allow me to introduce my friend, Unlucky Larry. He’s fictional, thankfully.
But the feeling Larry represents is very real. Most investors worry they’ll be the one who finally invests just before everything falls apart.
Larry is the worst investor in history and has an extraordinary gift. He only invests in the S&P 500 Index at major market peaks.
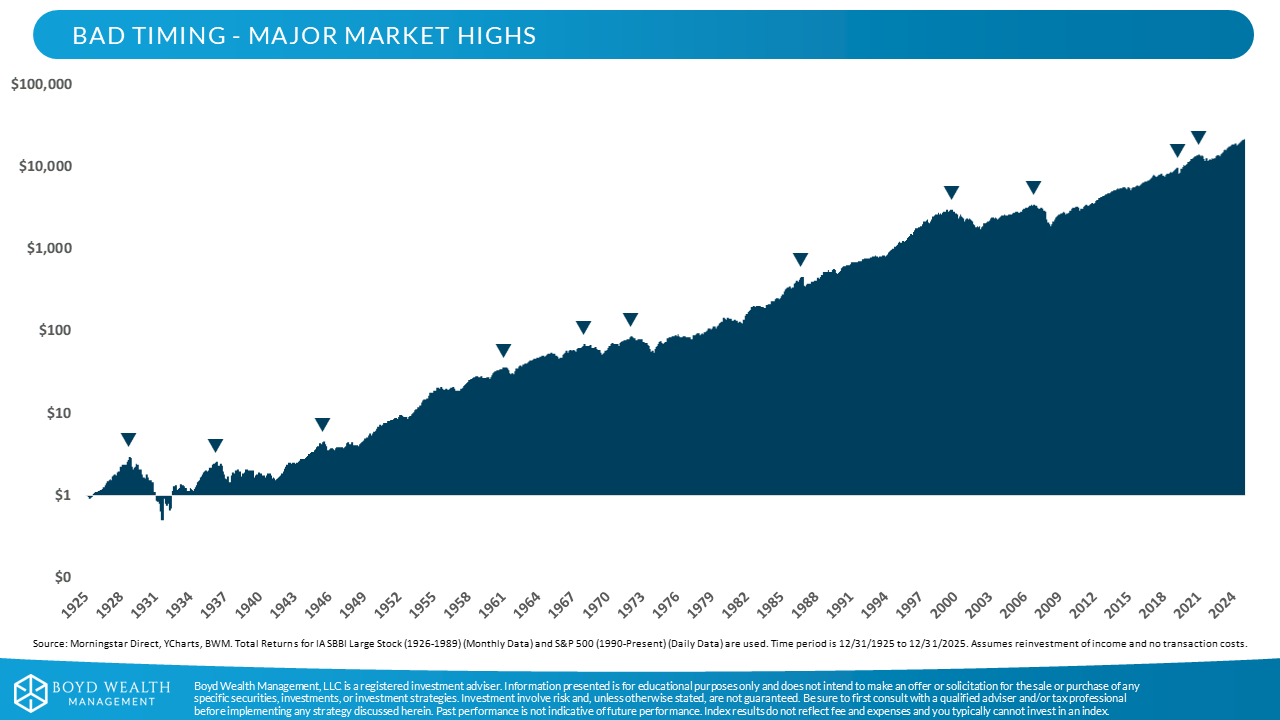
Not almost. Not usually. Every. Single. Time.
Larry invested just before the Great Depression.
Just before Black Monday.
Just before the dot-com crash.
Just before the Global Financial Crisis.
Just before COVID.
If CNBC interviewed Larry before he invested, you’d probably wait six months.
Surely Larry Was Doomed…
That’s what most people assume. Instead, here’s what happened.
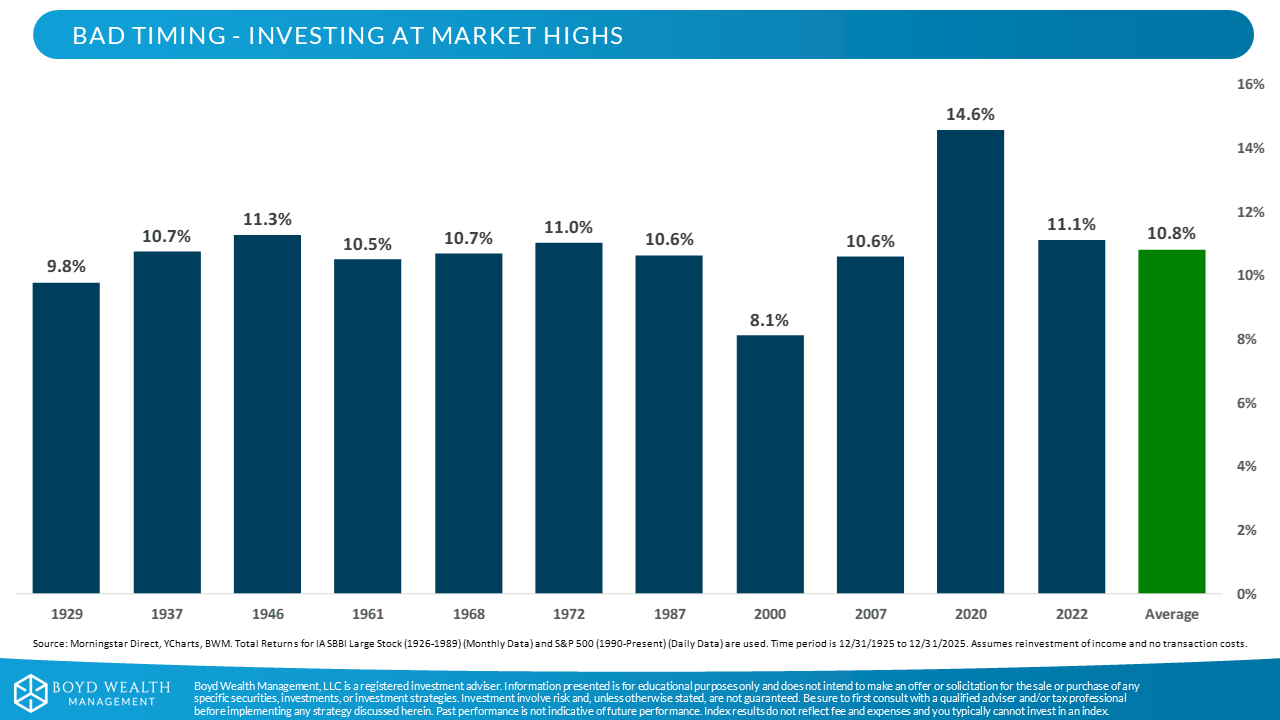
The figures here and below represent the historical annualized total returns of the S&P 500 (and its historical large-cap predecessor before 1957) from each of those market peaks through year-end 2025. Returns exclude management and advisory fees. An investment cannot be made directly into an index. These historical results include long periods of severe volatility, drawdowns, and extended recovery periods. Investors who needed liquidity, sold during declines, or had shorter time horizons may have experienced materially different outcomes.
Even though Larry bought at some of the worst possible moments in modern market history, his long-term results were surprisingly strong.
- 1929: 9.8% average annual return through 2025.
- 1987: 10.6% average annual return through 2025
- 2000: 8.1% average annual return through 2025
- 2007: 10.6% average annual return through 2025
- 2020: 14.6% average annual return through 2025
The dot-com example may be my favorite. Imagine investing $1 million at the absolute peak in early 2000. You would have spent years wondering if you had made a terrible mistake.
Yet by the end of 2025, that investment had still grown to more than $7 million.
Larry’s timing was awful, but his patience wasn’t. And patience turned out to matter far more.
We Asked a Different Question
We decided to look at the data another way. Instead of studying only the biggest market peaks, we looked at every new all-time high since 1990. Then we asked a simple question.
What happens if you invest when the market is making a new all-time high?
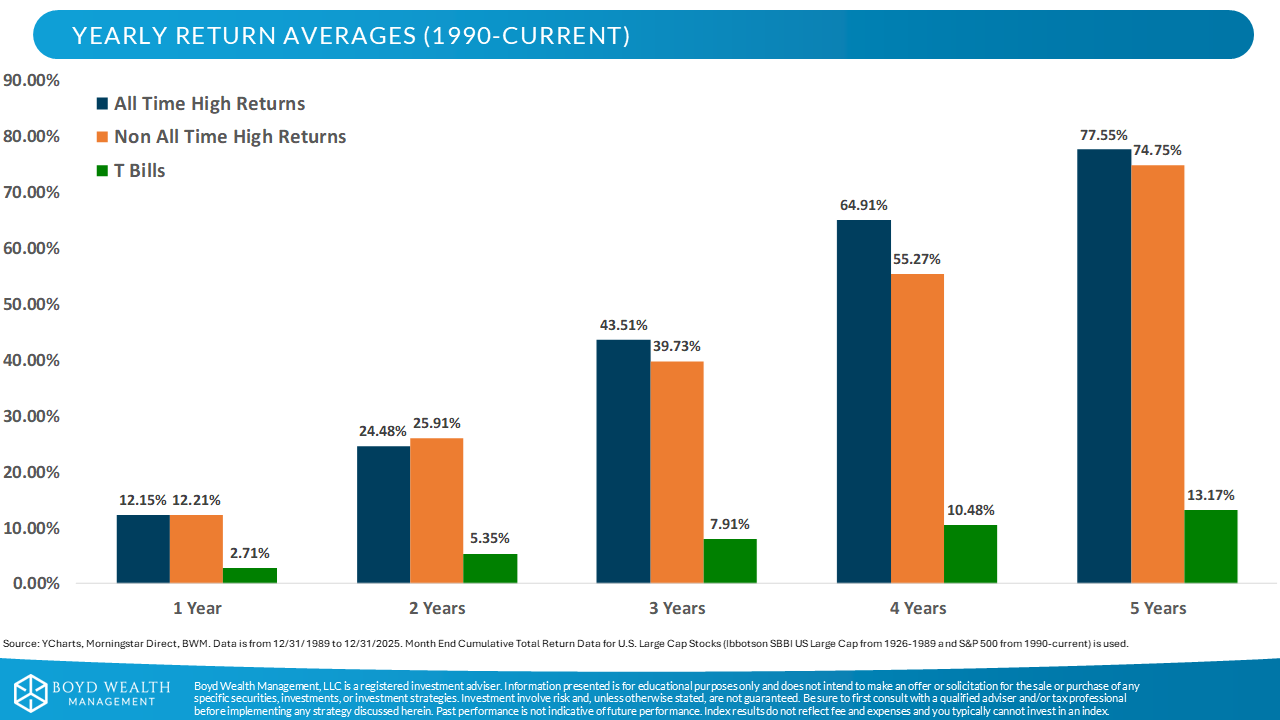
Most people assume that’s a terrible idea. The data says otherwise.
That doesn't mean markets can't decline after reaching a new high. They frequently do. It simply means that, historically, new highs have not been a reliable reason by themselves to stay out of the market.
One year later, there was essentially no difference. Two years later, investing at non-all-time highs held a slight edge. But by years three, four, and five, investing at all-time highs actually produced slightly higher average returns. That feels backwards, until you consider something important.
Markets don't automatically stop because they've reached a new high. Historically, many all-time highs have eventually been followed by additional all-time highs, although the path has rarely been a straight line.
There's one more important comparison.
Look at the green bars.
They represent cash, specifically Treasury Bills.
Whether someone invested at the perfect time, the worst time, or somewhere in between, getting the money invested outperformed Treasury Bills over the five-year periods studied.
The Irony
Many investors spend years worrying about investing at the wrong time. Very few spend enough time worrying about not investing at all. History suggests the second mistake has often been the more expensive one.
Cash is safe for money you need soon. It can be surprisingly risky for money you won’t need for another twenty years. That’s the opportunity cost that is rarely talked about.
What Should You Do?
This isn’t an argument for recklessness. If you’ll need the money in the next few years, it shouldn’t be invested in stocks. If your portfolio needs rebalancing, rebalance. If you need bonds to diversify, own some bonds. Risk still matters.
But if you’re holding long-term investment dollars because you’re worried the market has gone up too much, history offers a comforting reminder.
And, you don’t have to invest everything tomorrow.
In fact, many investors sleep better by spreading their investing systematically over several months. A disciplined investment plan can reduce the emotional burden of getting started while putting your cash to work. While it doesn't guarantee a better outcome than investing all at once, many investors find it easier to stick with their plan.
There is no rule that says it has to be all or nothing.
Larry’s Lesson
Our job isn’t to predict what the market will do over the next 12 months.
It’s to build a portfolio that still makes sense five, ten, and twenty years from now. It’s to build a portfolio designed to give you the best chance at long-term financial security.
Poor Unlucky Larry never learned how to time the market.
Fortunately for him, he didn’t have to. And the good news is…
Neither do you.
Happy planning,
Brian
This material is for informational and educational purposes only and should not be construed as individualized investment advice or a recommendation to buy, sell, or hold any security. Historical index returns are shown for illustrative purposes only and do not represent the performance of any client account, Boyd Wealth portfolio, or investment recommendation. Indexes are unmanaged, cannot be invested in directly, and do not reflect advisory fees, transaction costs, taxes, or individual investor circumstances. Past performance does not guarantee future results. Investing involves risk, including the possible loss of principal. Actual results will vary. Any comparison to Treasury Bills or other benchmarks is provided for context only and may not reflect the return available to any particular investor. Investors should consider their goals, time horizon, liquidity needs, tax situation, and risk tolerance before making investment decisions.